
Open Charts
Open Charts provides a detailed overview of your OpenAI usage, helping you understand the sources of consumption and how it evolves over time.
About
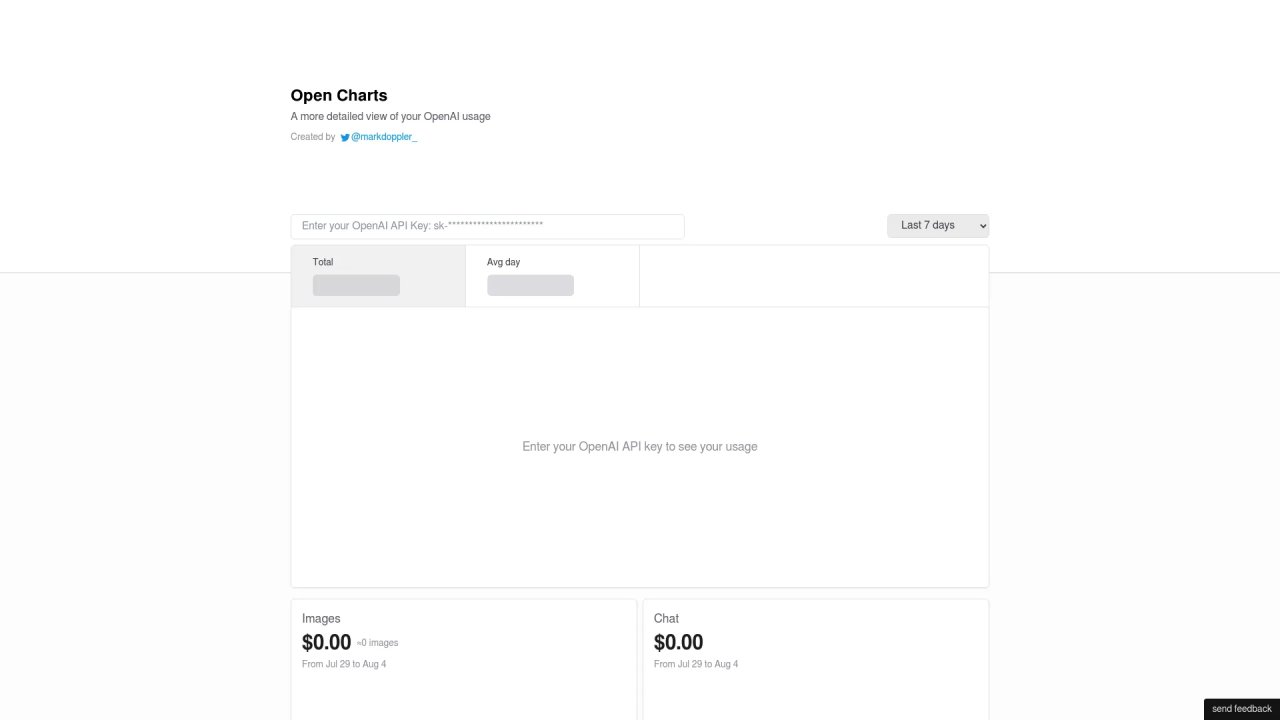
Open Charts provides a detailed overview of your OpenAI usage, helping you understand the sources of consumption and how it evolves over time. After entering your OpenAI API key, it displays usage data across various time frames—such as the last 7, 14, and 30 days, as well as the last 2 and 3 months—along with the total cost and estimated activity levels.
The dashboard categorizes your usage into clear segments: Images, Chat, Embeddings, and Instruct models. For each category and timeframe, you can easily view the expenses and approximate usage amounts, as well as average daily figures. This facilitates the identification of usage spikes, period comparisons, and cost management with enhanced context beyond simple aggregate numbers.
Open Charts is particularly useful for developers and teams seeking a straightforward view of their API expenditures and usage patterns. If you're monitoring diverse model types rather than a single endpoint or feature, the categorized breakdown assists in pinpointing areas of high usage.
Pricing or specific paid plans are not detailed in the provided information. Open Charts is focused on viewing and tracking your OpenAI API usage once you've input your API key.
It tracks OpenAI usage across four categories: Images, Chat, Embeddings, and Instruct models, displaying total cost and approximate usage for selected timeframes.
To use Open Charts, input your OpenAI API key. After that, it will show your usage data for the specified time ranges and categories.
You can view usage data for the last 7 days, last 14 days, last 30 days, last 2 months, last 3 months, and an overall summary.
For each category (Images, Chat, Embeddings, Instruct models) and timeframe, you'll see the associated costs and approximate usage amounts, along with average daily figures.
Open Charts presents multiple time windows, including an average-per-day metric, enabling you to compare how usage and costs fluctuate over different periods.
Detailed pricing information or specific plans are not included in the available data, so it's recommended to use the tool directly to confirm any costs or access requirements.