
In recent years, there has been a significant advancement in the field of Artificial Intelligence (AI) and Augmented Reality (AR). These technologies have become increasingly popular and have the potential to enhance virtual experiences in various fields such as gaming, education, healthcare, and...
A Program Creates Interactive Maps of Historical Battles
130
31.07.2026
Why interactive battle maps matter
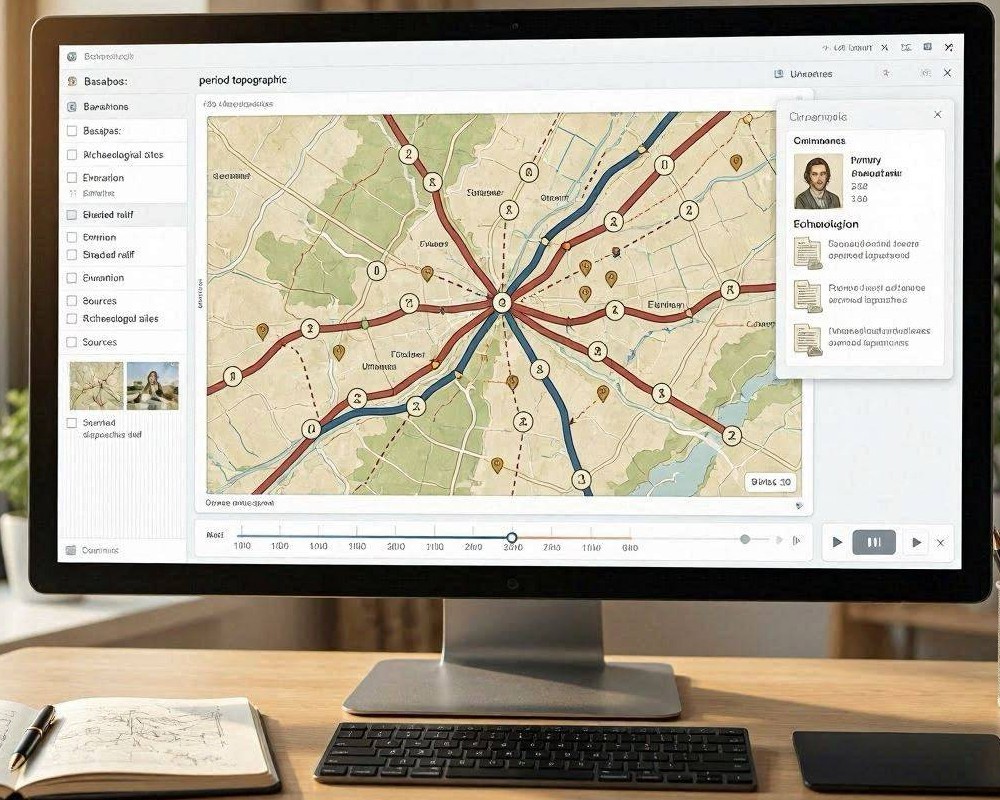
Interactive maps turn historical battles from static illustrations into navigable experiences. Instead of asking readers to infer geography from a few lines of description, a program can connect locations, dates, and troop movements into a visual narrative. This makes research more transparent and learning more accessible-especially when multiple perspectives, routes, and outcomes must be compared side by side.
When done well, an interactive map also supports scholarly habits: verifying claims against sources, checking the accuracy of coordinates, and understanding how uncertainty affects interpretation. The result is not just “a map,” but a tool that helps users explore history with context.
Core components of a battle-mapping program
A typical system that creates interactive maps of historical battles combines several technical and editorial layers. Each layer answers a different question: Where did events occur, when did they happen, how did people move, and how confident are we in the reconstruction?
1) Data ingestion and source management
The program begins by collecting information from reliable materials: archival descriptions, battlefield studies, gazetteers, scholarly atlases, and sometimes digitized field maps. Since historical geography can be messy, the workflow usually stores both the extracted facts and the citation trail that justifies them.
Good systems maintain structured records for:
- Place names and aliases used in different eras
- Estimated coordinates and their accuracy radius
- Event timestamps or date ranges
- Actor identities (armies, units, leaders) and organizational changes
2) Geocoding and historical coordinate alignment
Modern maps use standardized coordinate systems, but historical documents often refer to vanished settlements or changed boundaries. A program therefore performs historical geocoding: matching old place names to current locations, reconciling variant spellings, and converting between projections.
To avoid false precision, the system may represent uncertain locations as areas rather than single points. For example, if a description places an engagement “near a river crossing,” the program can treat the crossing as a region and clearly communicate the confidence level.
3) GIS modeling of terrain and spatial context
Battle outcomes rarely depend on geography alone, but terrain shapes routes, visibility, and logistics. Interactive maps often include layers such as rivers, elevation, coastlines, roads, and land cover. The program integrates these datasets in a consistent coordinate framework so that every subsequent overlay—routes, positions, fields of action—aligns correctly.
Even when high-detail terrain is not available, simplified modeling can still be useful: slope approximations, watershed lines, and prominent ridges can meaningfully change how a user interprets movement and constraints.
Building interactive features that explain events
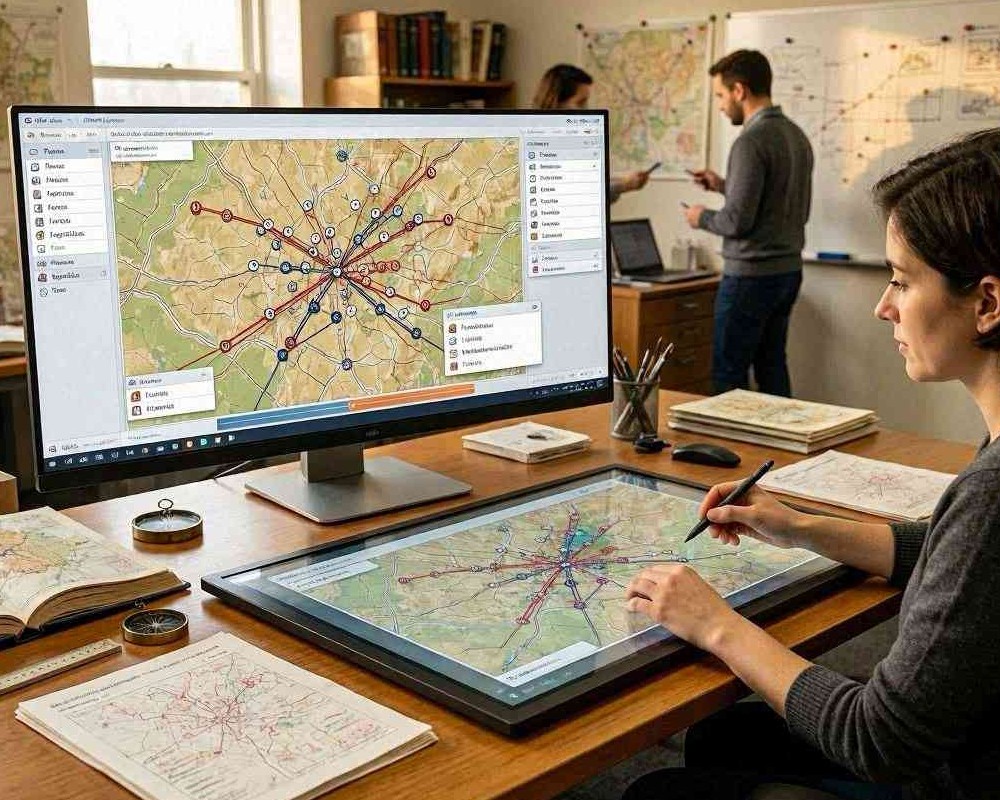
Once spatial data is ready, the program focuses on user interaction and interpretability. Interactivity should guide attention without overwhelming the viewer.
Layered visualization and timeline controls
A strong battle map usually separates information into layers: baseline terrain, key locations, troop markers, and event annotations. Users can toggle layers to isolate what matters for a specific question. A timeline control can also animate sequences-such as advances, retreats, encirclements, or artillery deployments-while preserving the underlying historical chronology.
Routes, areas of influence, and uncertainty displays
Movement is rarely a single line. A program often supports multiple representations:
- Routes for known marching paths
- Probable movement corridors when evidence is indirect
- Engagement polygons for areas of contact
- Confidence shading to communicate how strongly each geometry is supported
This approach helps users understand that some reconstructions are hypotheses rather than certainties.
Attribution, citations, and source transparency
Interactivity becomes valuable when it is accountable. A program can attach citations to markers, routes, or captions, so readers can open references directly from the map. This reduces the gap between visualization and scholarship, and it discourages “authoritative-looking” errors.
Quality assurance and performance considerations
Producing an interactive map is also an engineering task. Data errors, misalignment, and slow rendering can undermine trust. Quality checks typically include coordinate validation, duplicate place detection, and automated tests that confirm layer overlays match the chosen base map.
Performance matters as well: dense battles may involve many entities and geometry points. Efficient data tiling, optimized vector handling, and sensible defaults (such as clustered markers at low zoom levels) keep the experience responsive.
From reconstruction to research: best practices
The most effective programs treat a battle map as a living interpretation. As new scholarship emerges, the underlying data can be updated-while preserving previous versions and documenting what changed. By combining careful sourcing, historical geocoding, GIS-aware visualization, and clear uncertainty communication, a program can help users explore historical battles with both curiosity and rigor.
Ultimately, an interactive battle map succeeds when it answers more than “where”-it clarifies “when,” “how,” and “how sure we are,” turning visualization into a reliable research companion.